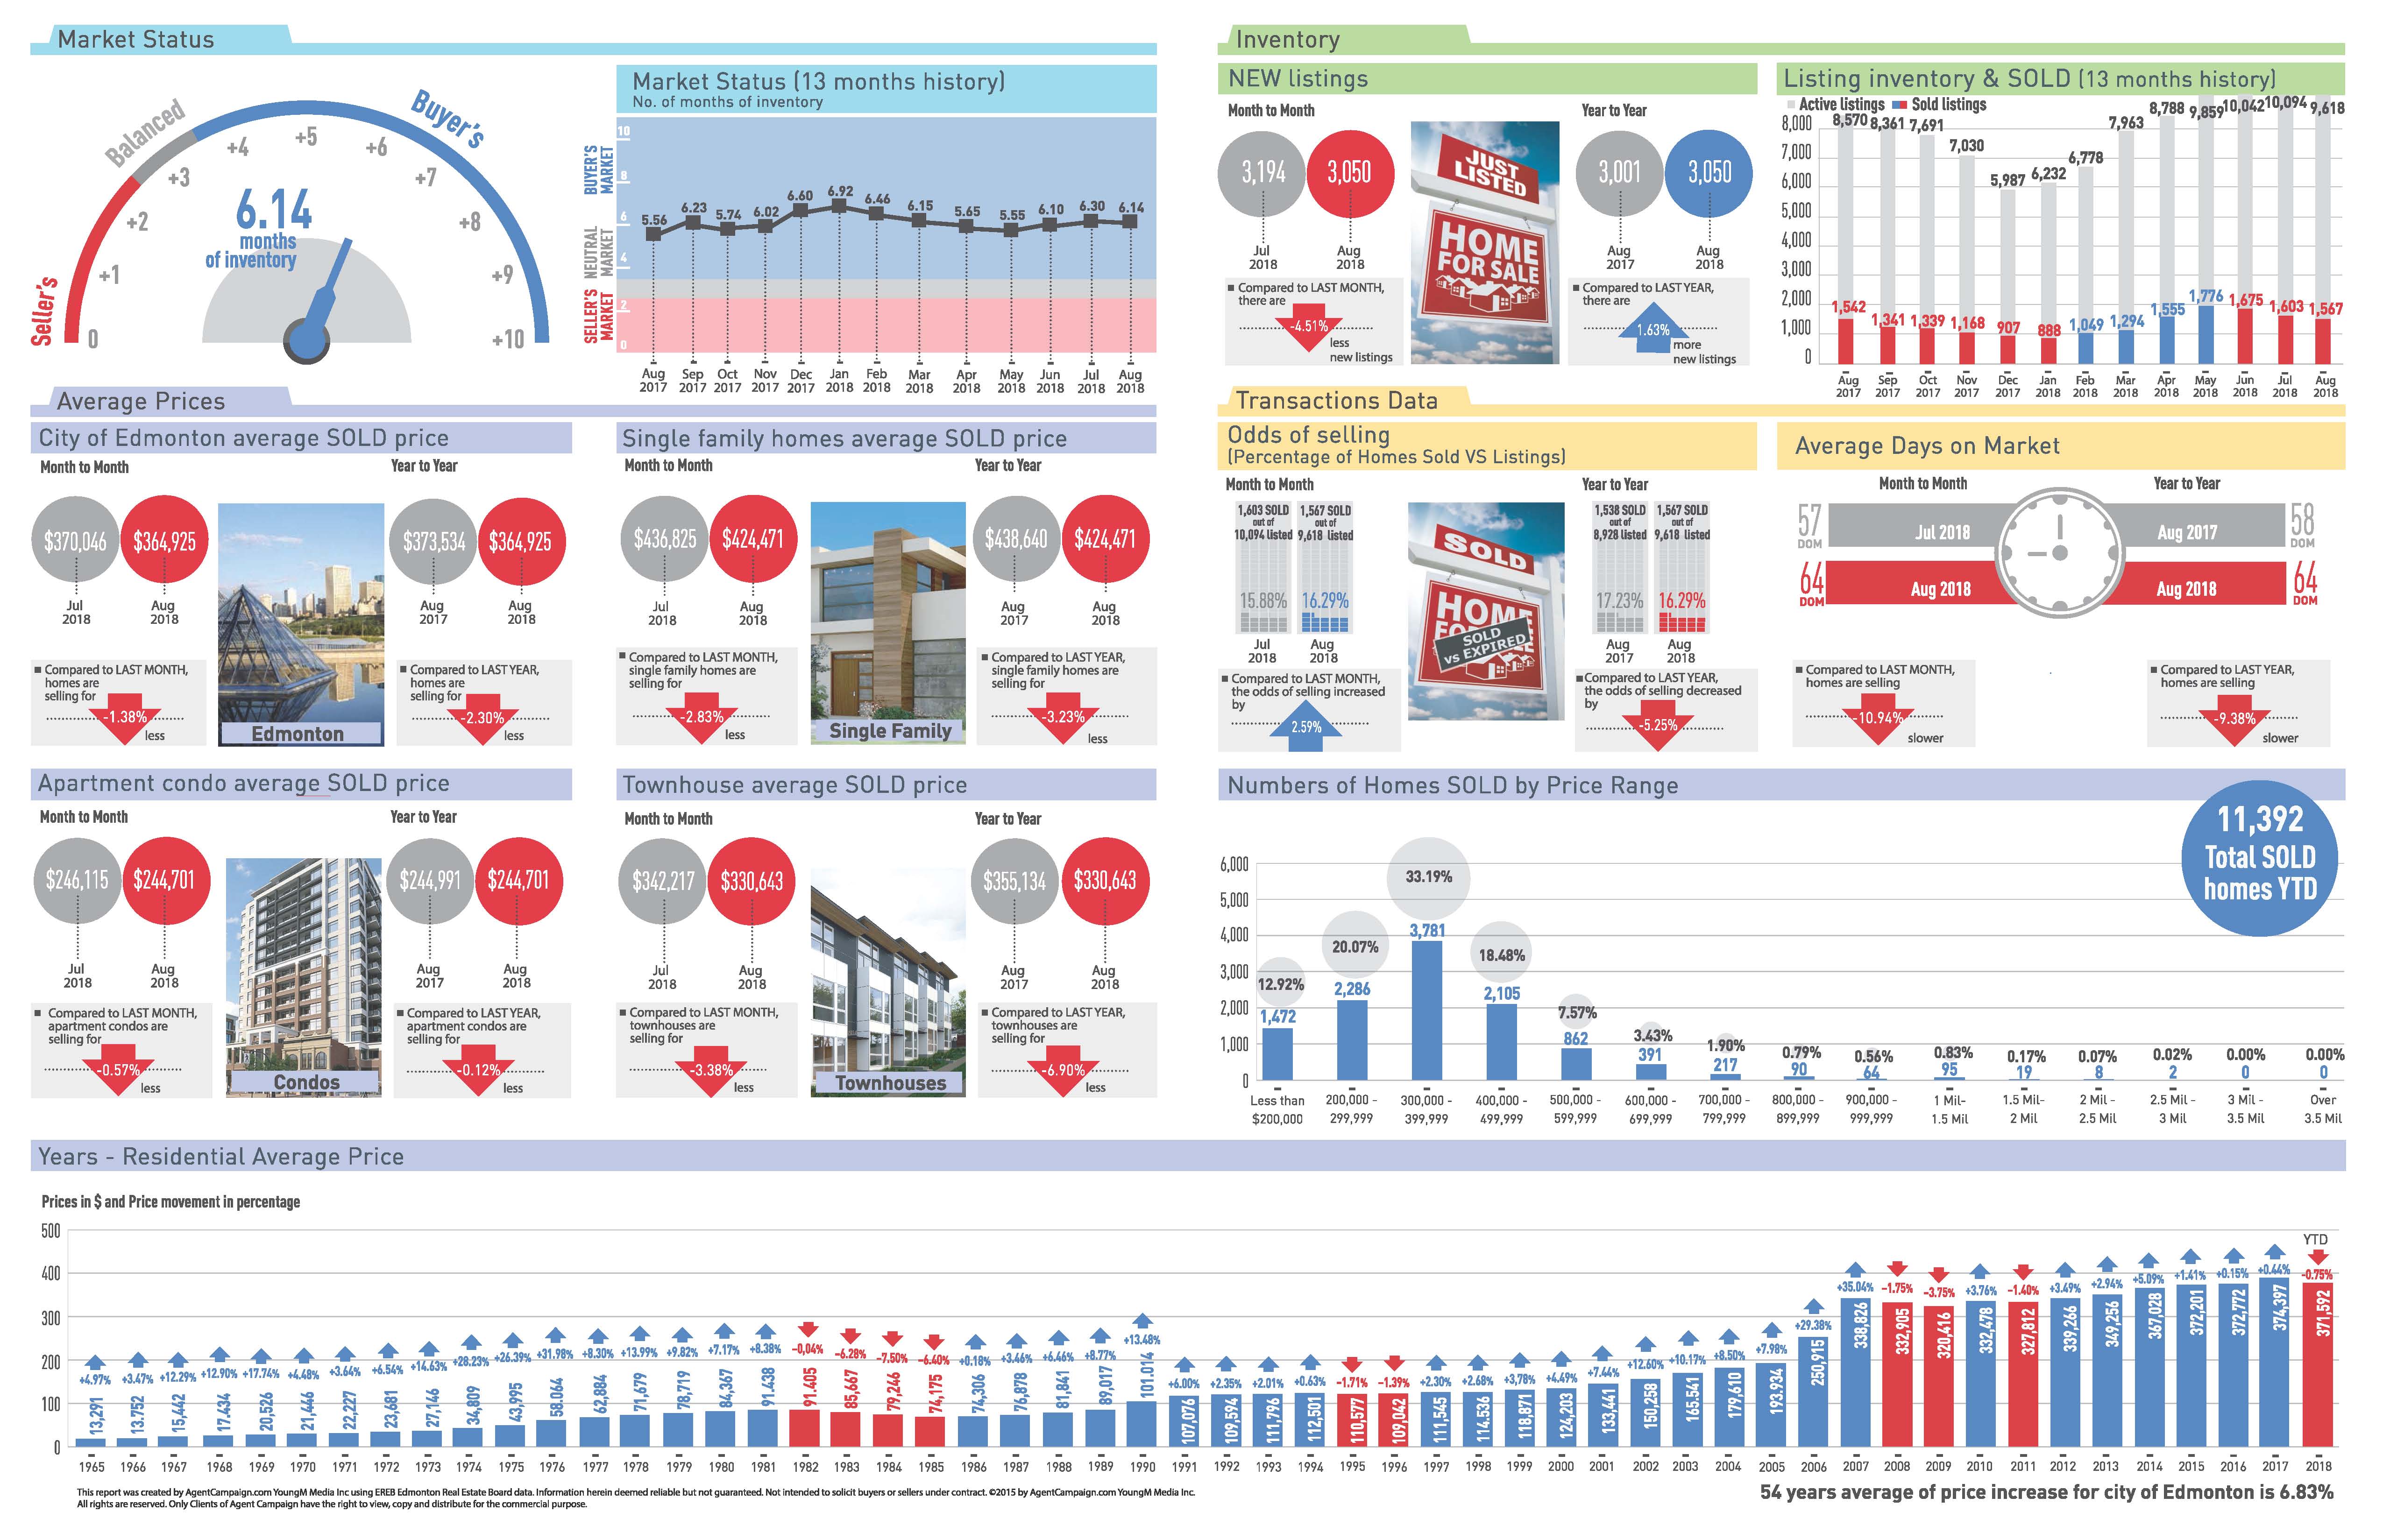
August, 2018: In the Edmonton Census Metropolitan Area (CMA), all residential average unit sales decreased 2.25% compared to July 2018 and increased 1.89% compared to August 2017. Single family home sales increased both 1.44% month over month and 6.15% year over year.
Condominium sales decreased 6.34% relative to July 2018 and increased 0.5% relative to August 2017. Duplex/rowhouses decreased 10.29% month over month and decreased 14.67% year over year. The average all residential selling price decreased 1.38% to $364,925 compared to July 2018 and decreased 2.30% compared to August 2017. Single family home average prices decreased 2.83% to $424,471 month over month and decreased 3.23% year over year. Condominium average prices decreased 0.57% compared to July 2018 and decreased 0.12% compared to August 2017. Duplex/rowhouse average prices decreased 3.38% month over month and decreased 6.90% year over year.
“Both sales and listings typically decrease during August, as many buyers and sellers shift their focus on preparing for the new school year,” says REALTORS® Association of Edmonton Chair Darcy Torhjelm. “As we move into the fall, buyers still have a lot of inventory to look at in all categories of residential properties. For sellers, they may have to be more patient and flexible when selling their properties, but they should still be able to get a good price for their house in the end.” Listings decreased 4.51% compared to July 2018 and increased 1.63% compared to August 2017.
Inventory also decreased month over month, down 2.62% and increased 7.73% year over year. In total, there were 1,567 MLS® System listed properties sold in August 2018, a decrease of 2.25% month over month and an increase of 1.89% year over year.
Average days on market increased for most categories, indicating it continues to be a buyers’ market for the Edmonton CMA. The average for single family homes increased to 59 days for August 2018, seven days longer than July 2018 and eight days longer than August 2017. Condominiums average days on market increased to 73 in August 2018, seven days longer than July 2018 and five days longer compared to August 2017. For duplex/rowhouses, the average days on market was 63, increasing from 61 in July 2018 and one day shorter relative to August 2017.


Follow us on:
Google+ Facebook Twitter YouTube Email