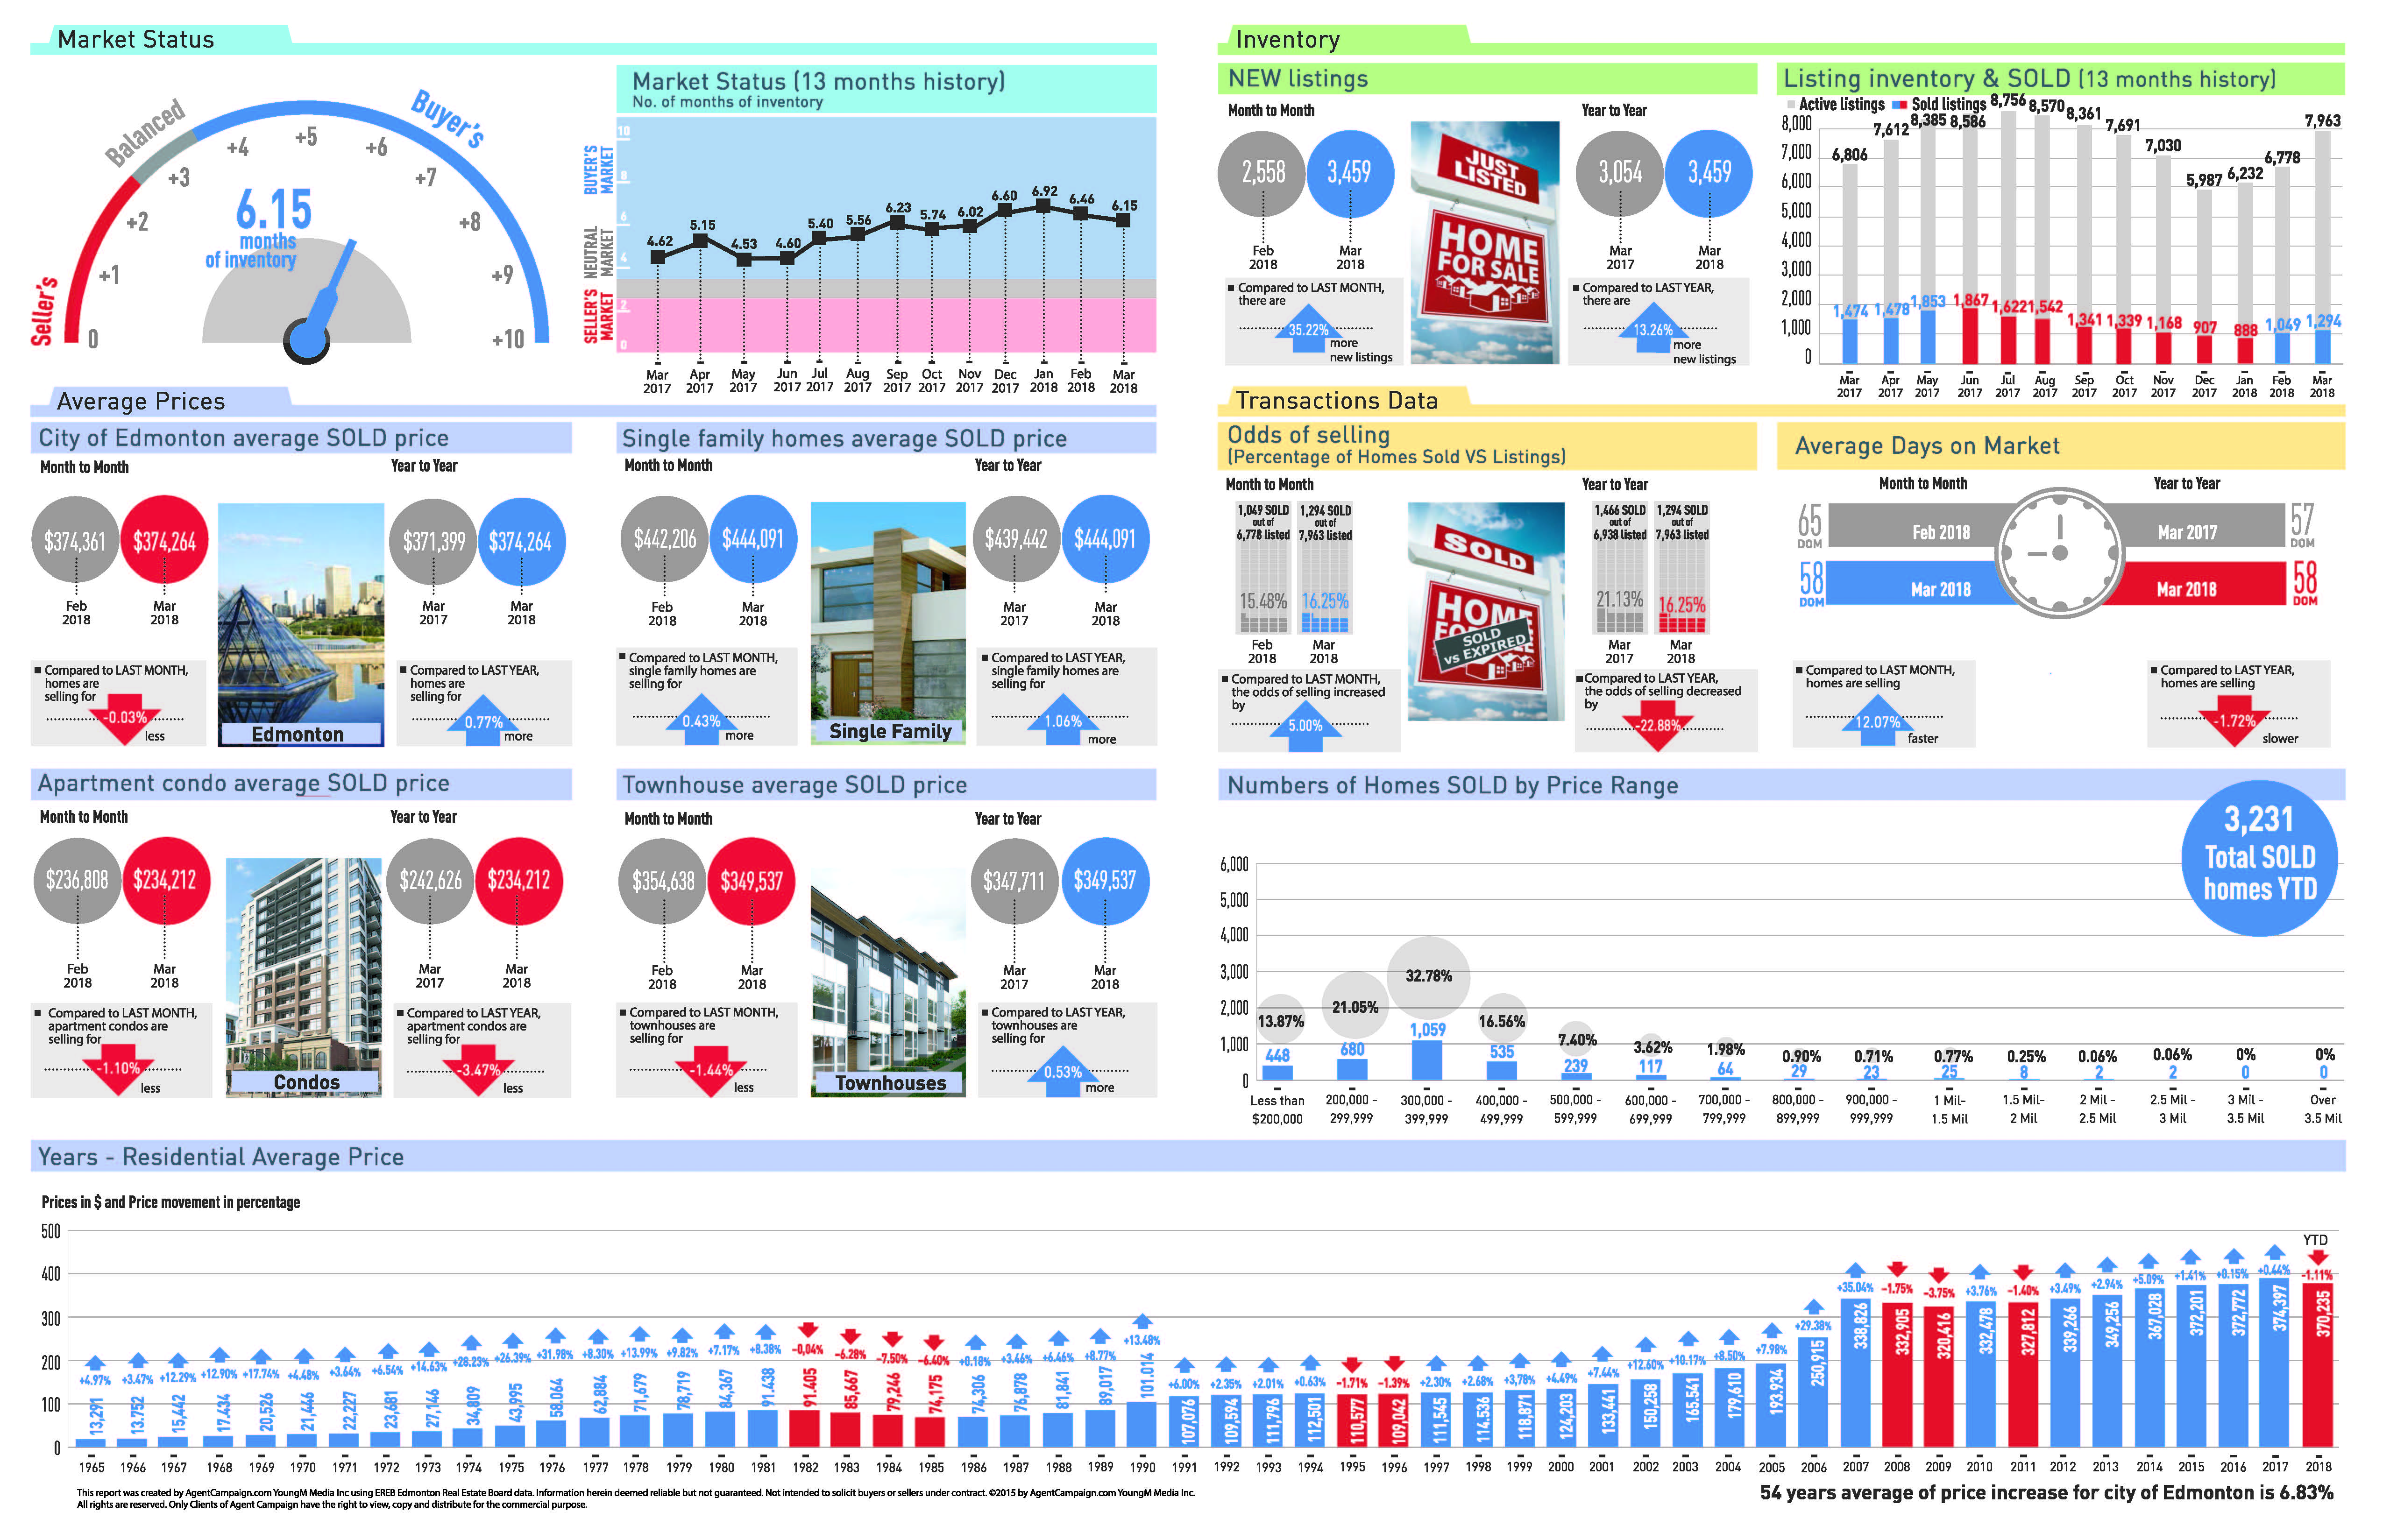
March, 2018: In the Edmonton Census Metropolitan Area (CMA) in March 2018, month over month unit sales increased in all categories. Single family home sales increased 24.18%, condominium sales increased 16.90% and duplex/rowhouse sales increased 22.81% compared to February 2018. Year over year sales were down. Single family home sales decreased 11.32%, condominium sales decreased 14.82%. Duplex/rowhouse sales decreased 3.45%. On average across all categories, year over year sales for all residential properties decreased 11.73%.
There were 1,294 MLS® System listed properties sold, which is an increase of 23% compared to February 2018. New listings in March were 3,459, up 35.22% relative to February 2018 and up 13.26% compared to March 2017.
Inventory increased both month over month and year over year. There were 7,963 properties available, an increase of 17.48% compared to February 2018 and an increase of 14.77% compared to March 2017. Days on market also decreased across all categories. For single family homes, the average days on market was 51, down from 59 in February 2018 and up from 49 in March 2017. Condominium average days on market was 72, down from 75 the previous month, and up from 67 in March 2017. For duplex/rowhouses ,the average days on market was 57 down from 64 in February 2018 and up from 61 in March 2017.
The average price of a single family home was $444,091, an increase of 0.43% month over month and 1.06% year over year. Condominium average prices decreased 1.10% compared to February 2018 and decreased 3.47% relative to March 2017. Duplex/rowhouse average prices decreased 1.44% month over month and increase 0.53% year over year. Overall, the all residential average price was $374,264, down only 0.03% compared to February 2018 and up 0.77% relative to March 2017.


Follow us on:
Google+ Facebook Twitter YouTube Email